Spring Cloud - Springboot Actuator
in DEV on MSA(Spring) Springboot-actuator Spring-monitoring Actuator Spring-admin-ui
- Springboot Actuator란?
- Actuator 설정
- Actuator 정보 확인
- Springboot admin UI ?
- Springboot admin UI 설정
- Springboot admin UI 확인
- 참고사이트
Springboot Actuator란?
스프링부트 액추에이터란 스프링부트 애플리케이션에서 제공하는 여러가지 정보를 모니터링하기 쉽게 정리해주는 스프링부트 기능이다.
각 인스턴스에 대한 CPU, Memory, Heap 등을 개별 모니터링하려면 앞이 참 캄캄하다. (저는 그래요..)
하지만 스프링부트 액추에이터는 이러한 정보들을 종합적으로 정리하여 제공해준다.
즉, 스프링부트 애플리케이션을 운영하고 관리하는데 필요한 기능들을 쓰기 쉬운 형태로 제공을 해주는데 어떠한 정보를 제공해주는지 한번 알아보도록 하자.
Actuator 설정
스프링부트 액추에이터는 메이븐과 application.properties 추가만으로 간단히 설정이 가능하다.
pom.xml
 <dependency>
     <groupId>org.springframework.boot</groupId>
     <artifactId>spring-boot-starter-actuator</artifactId>
</dependency>
application.properties
management.endpoints.web.exposure.include=*
management.endpoint.shutdown.enabled=true
물론 application.properties 는 추가로 설정가능한 프로퍼티들이 더 있지만 지금은 간단히 저 정도만 기입한다.
자, 이제 스프링부트 액추에이터를 사용할 수 있는 환경이 마련되었으니 애플리케이션을 구동하여 어떠한 정보들이 나오는지 확인해보자.
Actuator 정보 확인
로컬 서버를 띄운 후 아래 주소로 접속을 해보면 JSON 형태로 여러가지 정보를 노출시켜 준다.
http://localhost:8080/actuator
{
  "_links": {
    "self": {
      "href": "http://localhost:8080/actuator",
      "templated": false
    },
    "beans": {
      "href": "http://localhost:8080/actuator/beans",
      "templated": false
    },
    "caches-cache": {
      "href": "http://localhost:8080/actuator/caches/{cache}",
      "templated": true
    },
    "caches": {
      "href": "http://localhost:8080/actuator/caches",
      "templated": false
    },
    "health": {
      "href": "http://localhost:8080/actuator/health",
      "templated": false
    },
    "health-path": {
      "href": "http://localhost:8080/actuator/health/{*path}",
      "templated": true
    },
    "info": {
      "href": "http://localhost:8080/actuator/info",
      "templated": false
    },
    "conditions": {
      "href": "http://localhost:8080/actuator/conditions",
      "templated": false
    },
    "shutdown": {
      "href": "http://localhost:8080/actuator/shutdown",
      "templated": false
    },
    "configprops": {
      "href": "http://localhost:8080/actuator/configprops",
      "templated": false
    },
    "env": {
      "href": "http://localhost:8080/actuator/env",
      "templated": false
    },
    "env-toMatch": {
      "href": "http://localhost:8080/actuator/env/{toMatch}",
      "templated": true
    },
    "loggers": {
      "href": "http://localhost:8080/actuator/loggers",
      "templated": false
    },
    "loggers-name": {
      "href": "http://localhost:8080/actuator/loggers/{name}",
      "templated": true
    },
    "heapdump": {
      "href": "http://localhost:8080/actuator/heapdump",
      "templated": false
    },
    "threaddump": {
      "href": "http://localhost:8080/actuator/threaddump",
      "templated": false
    },
    "metrics-requiredMetricName": {
      "href": "http://localhost:8080/actuator/metrics/{requiredMetricName}",
      "templated": true
    },
    "metrics": {
      "href": "http://localhost:8080/actuator/metrics",
      "templated": false
    },
    "scheduledtasks": {
      "href": "http://localhost:8080/actuator/scheduledtasks",
      "templated": false
    },
    "mappings": {
      "href": "http://localhost:8080/actuator/mappings",
      "templated": false
    },
    "jolokia": {
      "href": "http://localhost:8080/actuator/jolokia",
      "templated": false
    }
  }
}
위에 나와 있는 링크들을 들어가보면 상세 정보를 확인할 수 있다.
가장 간단한 health check 링크에 접속해보면 아래와 같이 인스턴스가 정상 구동중임을 알려주고 있다.
http://localhost:8080/actuator/health
{
  "status": "UP"
}
아무래도 metrics 에 우리가 관심있어 하는 정보들이 많이 들어있다.
http://localhost:8080/actuator/metrics 에서 제공하는 지표들은 아래와 같다.
{
  "names": [
    "jvm.memory.max",
    "jvm.threads.states",
    "jvm.gc.pause",
    "jvm.gc.memory.promoted",
    "jvm.memory.used",
    "jvm.gc.max.data.size",
    "jvm.memory.committed",
    "system.cpu.count",
    "logback.events",
    "http.server.requests",
    "jvm.buffer.memory.used",
    "tomcat.sessions.created",
    "jvm.threads.daemon",
    "system.cpu.usage",
    "jvm.gc.memory.allocated",
    "tomcat.sessions.expired",
    "jvm.threads.live",
    "jvm.threads.peak",
    "process.uptime",
    "tomcat.sessions.rejected",
    "process.cpu.usage",
    "jvm.classes.loaded",
    "jvm.classes.unloaded",
    "tomcat.sessions.active.current",
    "tomcat.sessions.alive.max",
    "jvm.gc.live.data.size",
    "jvm.buffer.count",
    "jvm.buffer.total.capacity",
    "tomcat.sessions.active.max",
    "process.start.time"
  ]
}- JVM 정보
- thread 수
- GC 정보
- PROCESS 관련 정보
- CPU
예를 들어 현재 JVM의 활성화된 Thread 정보는 아래와 같이 확인할 수 있다.
http://localhost:8080/actuator/metrics/jvm.memory.used
{
  "name": "jvm.memory.used",
  "description": "The amount of used memory",
  "baseUnit": "bytes",
  "measurements": [
    {
      "statistic": "VALUE",
      "value": 141052480.0
    }
  ],
  "availableTags": [
    {
      "tag": "area",
      "values": [
        "heap",
        "nonheap"
      ]
    },
    {
      "tag": "id",
      "values": [
        "Compressed Class Space",
        "PS Survivor Space",
        "PS Old Gen",
        "Metaspace",
        "PS Eden Space",
        "Code Cache"
      ]
    }
  ]
}http://localhost:8080/actuator/heapdump, http://localhost:8080/actuator/threaddump 를 통해 덤프 파일도 제공받을 수 있다.
이러한 애플리케이션의 상태 정보가 함부로 노출되면 안 되니 두 가지 방법으로 확인된 사용자에게만 노출해줄 수 있다.
management.server.port,management.server.address값을 수정해서 해당 ip, address에 한해서만 ACL를 건다. spring-security 를 이용하여management.endpoints.web.base-path(기본값은 /actuator) 에 대해 권한을 확인한다.
또한 management.endpoints.web.exposure.include=* 대신 필요한 endpoint id만 나열해줌으로써 노출 항목을 줄일 수도 있다.
자세한 endpoint id 정보는 docs.spring.io 에서 확인 가능하다.
또한 사용자 정의 Metrics 정보도 설정이 가능한데 예를 들어서 현재 처리중인 동시 request 수 혹은 분당 request 처리량도 표시할 수 있다.
MeterRegistry만 주입받아 사용하면 쉽게 구현 가능하다.
아래는 처리중인 동시 요청 수에 대한 예시이다.
ConcurrentTransactionCountInterceptor.java
@Component
public class ConcurrentTransactionCountInterceptor extends HandlerInterceptorAdapter {
    private final Counter counter;

    public ConcurrentTransactionCountInterceptor(MeterRegistry meterRegistry) {
        this.counter = meterRegistry.counter("transaction.current.count");
    }

    @Override
    public boolean preHandle(HttpServletRequest request, HttpServletResponse response, Object handler) throws Exception {
        counter.increment();
        return true;
    }

    @Override
    public void afterCompletion(HttpServletRequest request, HttpServletResponse response, Object handler, Exception ex) throws Exception {
        counter.increment(-1d);
    }
}
http://localhost:8080/actuator/metrics/transaction.current.count
{
  "name": "transaction.current.count",
  "description": null,
  "baseUnit": null,
  "measurements": [
    {
      "statistic": "COUNT",
      "value": 0
    }
  ],
  "availableTags": [

  ]
}
그런데..
저렇게 JSON 포맷으로 나오니 가독성이 너무 떨어진다.
이럴 땐 springboot admin UI를 사용하여 보다 쉽게 정보를 볼 수 있다.
springboot admin UI는 일종의 대시보드 기능이라고 생각하면 좋을 것 같다.
Springboot admin UI ?
스프링부트 액추에이터에서 제공하는 정보를 보기 쉽게 제공한다.
설정하는 방법 또한 메이븐과 어노테이션 추가만으로 설정이 가능하다.
Springboot admin UI 설정
pom.xml
<dependency>
    <groupId>de.codecentric</groupId>
    <artifactId>spring-boot-admin-starter-server</artifactId>
</dependency>

<dependency>
    <groupId>de.codecentric</groupId>
    <artifactId>spring-boot-admin-starter-client</artifactId>
</dependency>
application.properties
server.port=8080

spring.boot.admin.client.url=http://localhost:8080
spring.boot.admin.client.instance.service-url=http://localhost:8080
ActuatorApplication.java
@EnableAdminServer  // 어노테이션 추가
@SpringBootApplication
public class ActuatorApplication {
    public static void main(String[] args) {
        SpringApplication.run(ActuatorApplication.class, args);
    }
}
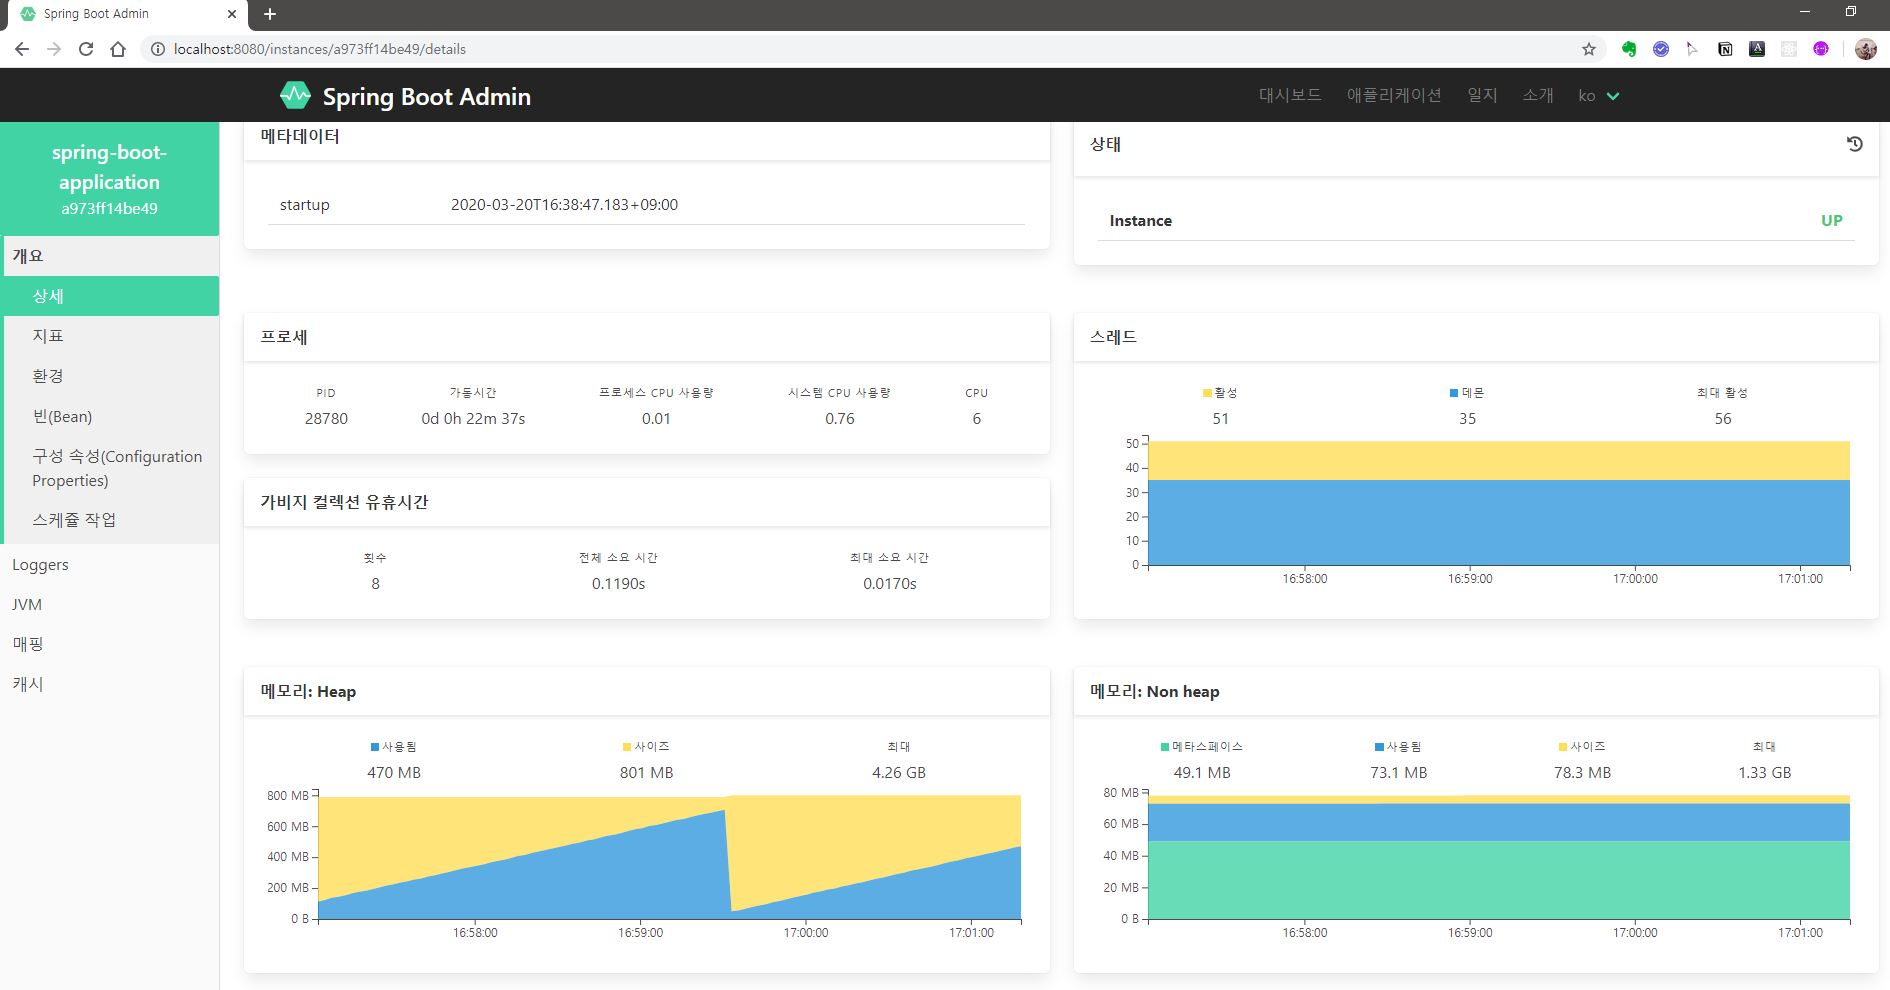
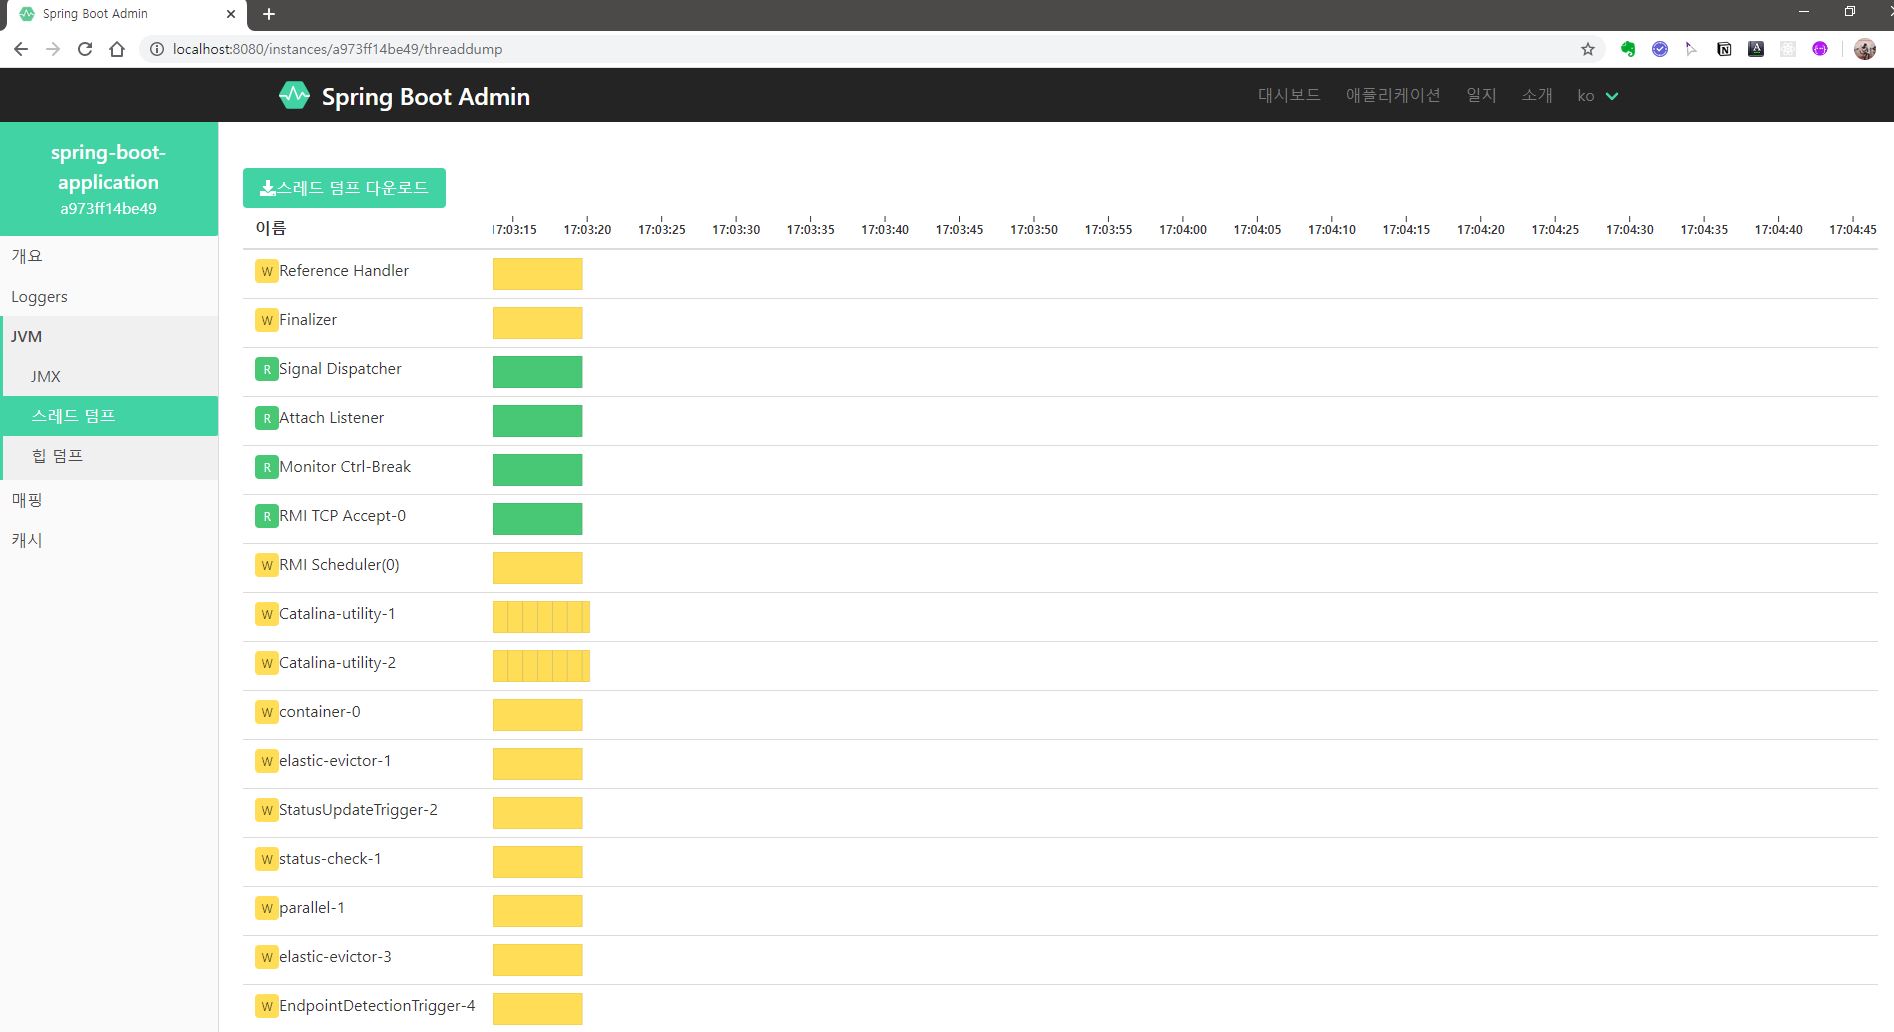
Springboot admin UI 확인
이제 http://localhost:8080/applications 로 접속하면 Springboot Admin UI를 볼 수 있다.
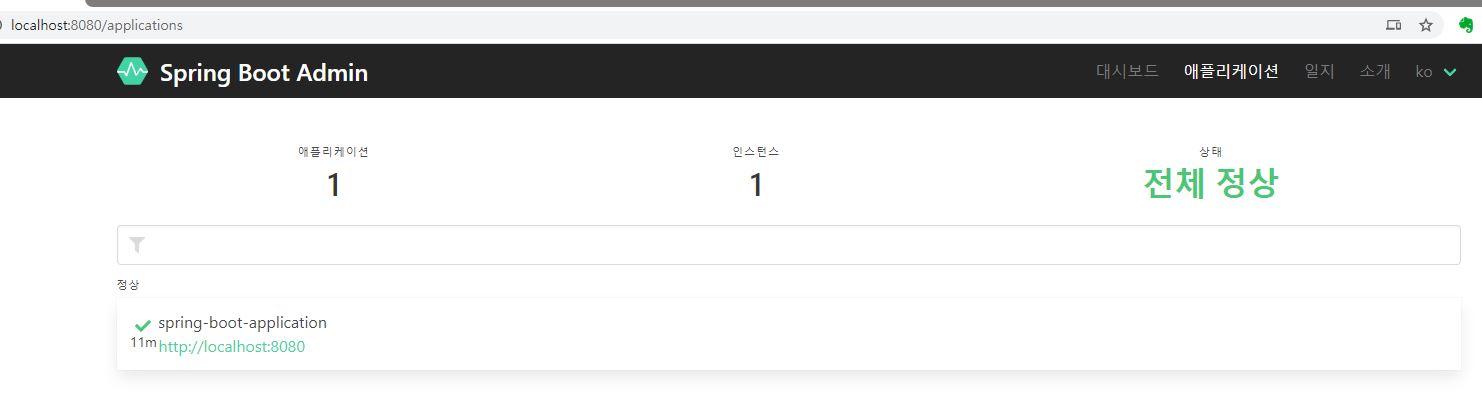
관련 소스는 github/assu10 에서 확인하실 수 있습니다.
참고사이트
- https://supawer0728.github.io/2018/05/12/spring-actuator/
- https://sncap.tistory.com/856
- https://jeong-pro.tistory.com/160